Brian Ruiz
December 15, 2019
This Application Idea Won Us First Place At A Microsoft Hackathon
The application would leverage the latest of Microsoft Azure and Machine Learning to help solve a $6.4 billion infrastructure issue.


The Challenge
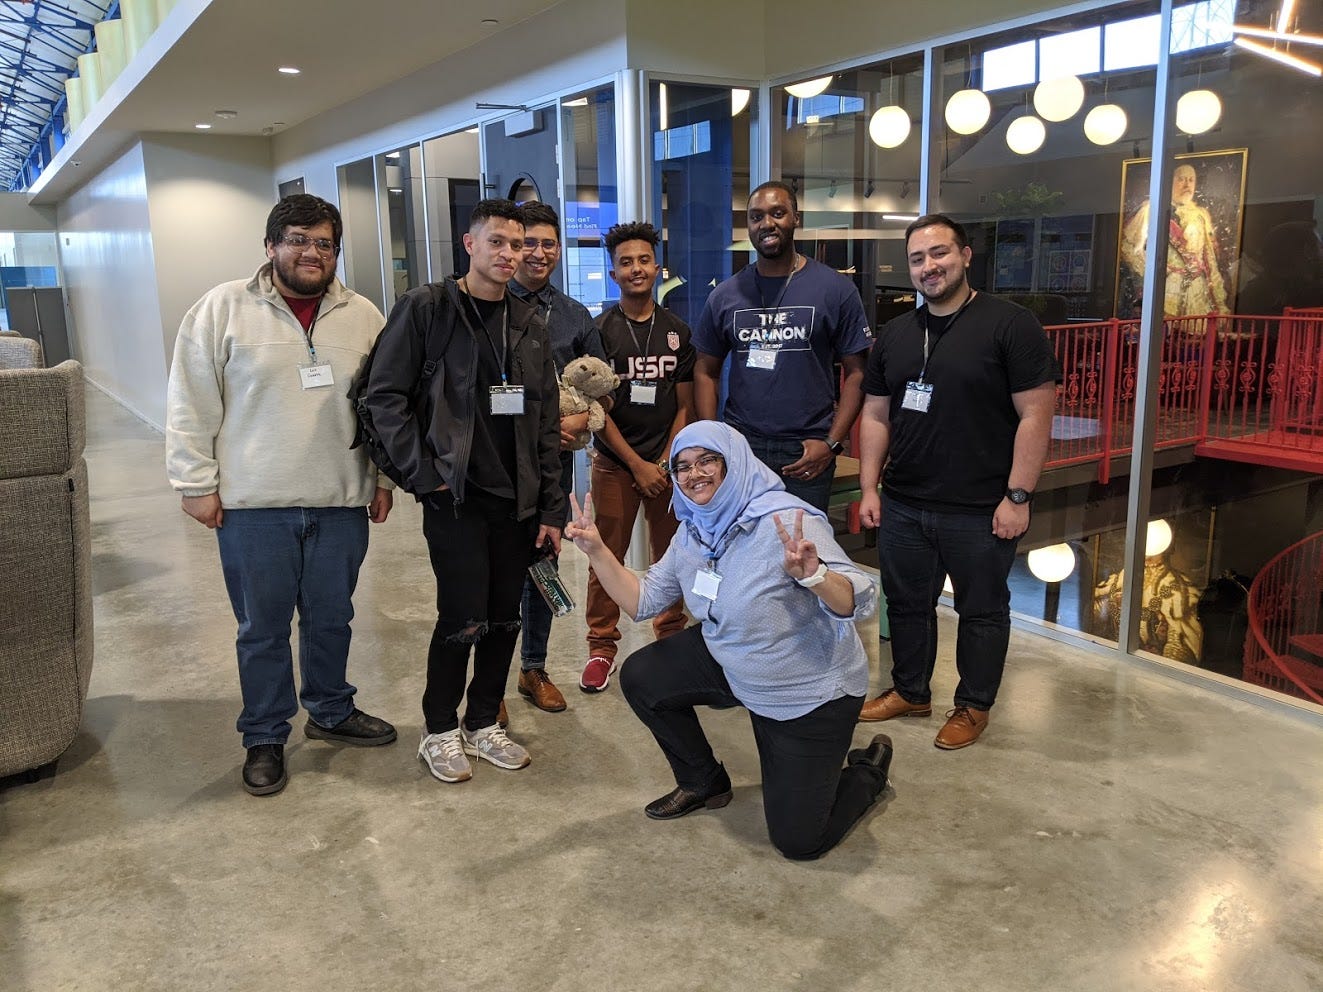
The main objective of the competition revolved around developing innovative solutions for improving the infrastructure of cities in the US. The 2019 Smart Infrastructure Hackathon was hosted at The Cannon (Houston), in partnership with Microsoft Azure. Thankfully, we had a team of really bright cloud solution architects for guidance.
Technology We’re Using
The technology we opted for the project revolved heavily around Python. For the phone data we used a publicly available mobile app that allowed exporting the data to CSV files. We then leverage Python’s scripting ability to analyze the data from the phone, to use for the road pothole detection algorithm.
Python also allowed us to create data visualizations —matplotlib— of our data which we used to tweak the algorithm. All of this was tied togther with the Microsoft Azure platform. From storing the data (CSV’s and images) in Azure, to using the Azure Machine Learning platform to train the model.

Our Idea and Proposal
After juggling several ideas we settled on the issue of road potholes. We discovered that potholes cost American drivers $6.4 billion per year, that is in repair and insurance costs. A single pothole may cause are up to $300 per year per vehicle (2016), while the average price to repair a pothole is on average $30 — $50 per pothole. Thus the effort to aid this issue can be cost-effective.
Looking at our challenge from a high level we need the following components or stages, to be able to solve the problem. Also, we need to design a 2-layer confirmation of a road pothole. The first is the active dashboard camera, and the second uses the user’s phone telemetry data, such as GPS and accelerometer modules.
- Data collection and analysis
- Pothole probability algorithm
- Minimal Interface
- Data visualization/mapping
1. Analyzing mobile telemetry data
Every modern smartphone is equipped with very accurate telemetry systems. For example, the GPS and accelerometer, which we leveraged for location and to track any abrupt movement indicating a pothole on the road.
One of the difficulties with this approach was that logging every high acceleration movement may result in false positives of a road pothole. Below is also a time-series data visualization of the accelerometer data, generated with matplotlib.
import pandas as pd
import matplotlib.pyplot as plt
df = pd.read_csv('/home/br/Downloads/testdata.csv')
df['Time'] = pd.to_datetime(df.Time, format='%Y-%m-%d %H:%M:%S:%f')
columns = [
  'ACCELEROMETER X (m/s²)',
  'ACCELEROMETER Y (m/s²)',
  'ACCELEROMETER Z (m/s²)',
  'Time'
]
df[columns].plot(x='Time')
plt.show()
2. Live computer vision
This part was more difficult to implement, but this was our second layer for prediction of potholes, implementation is done with some guidance from the Azure cloud architects.
We used Azure Logic Apps to import our road image frames to the cloud, and with OpenCV were able to register a model to start analyzing our content with the conveniently named Azure microservice Computer Vision.
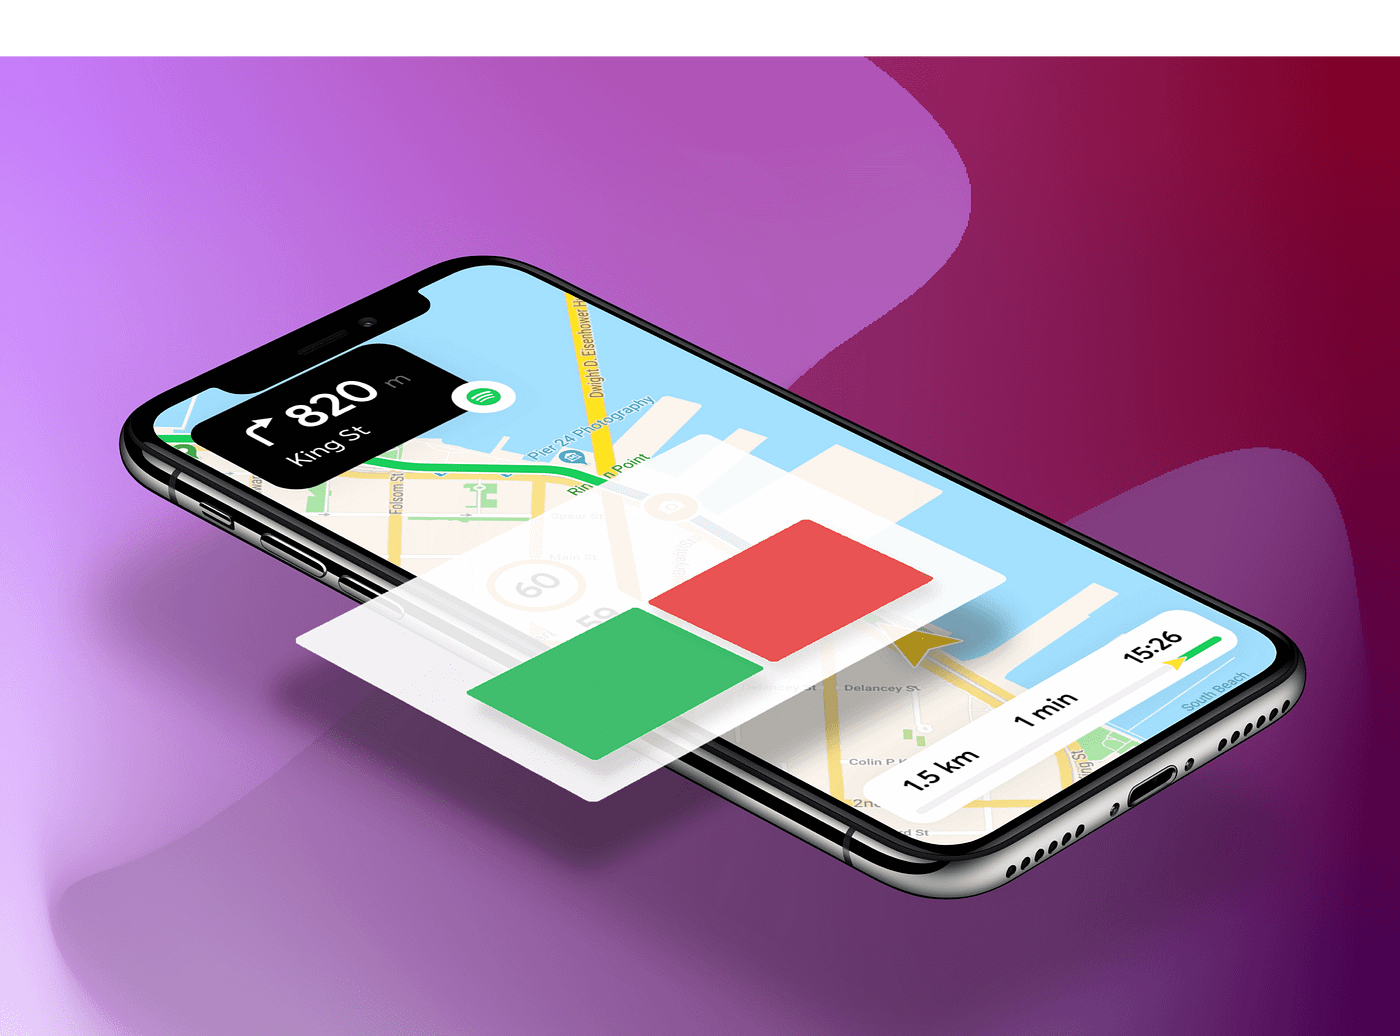
3. The Interface
From the start, the idea was to keep the interface as intuitive as possible to minimize driving distractions. Therefore, we intended to create an interface that would show a dialog box only when our system predicted there to be a pothole, from there the user would confirm if so.
4. Geocoding / Mapping
Finally, we needed to plot our GPS data so the city could take action. Our collected data included latitude, longitude, altitude, and location accuracy. Location accuracy is important to pinpoint multiple occurrences of the same pothole from different users for clustering the locations.
import folium
import pandas as pd

SF_COORDINATES = (37.76, -122.45)
map = folium.Map(location=SF_COORDINATES, zoom_start=12)
for each in df.iterrows():
  map.simple_marker(
    location = [each[1]['Y'],each[1]['X']],
    clustered_marker = True
  )

display(map)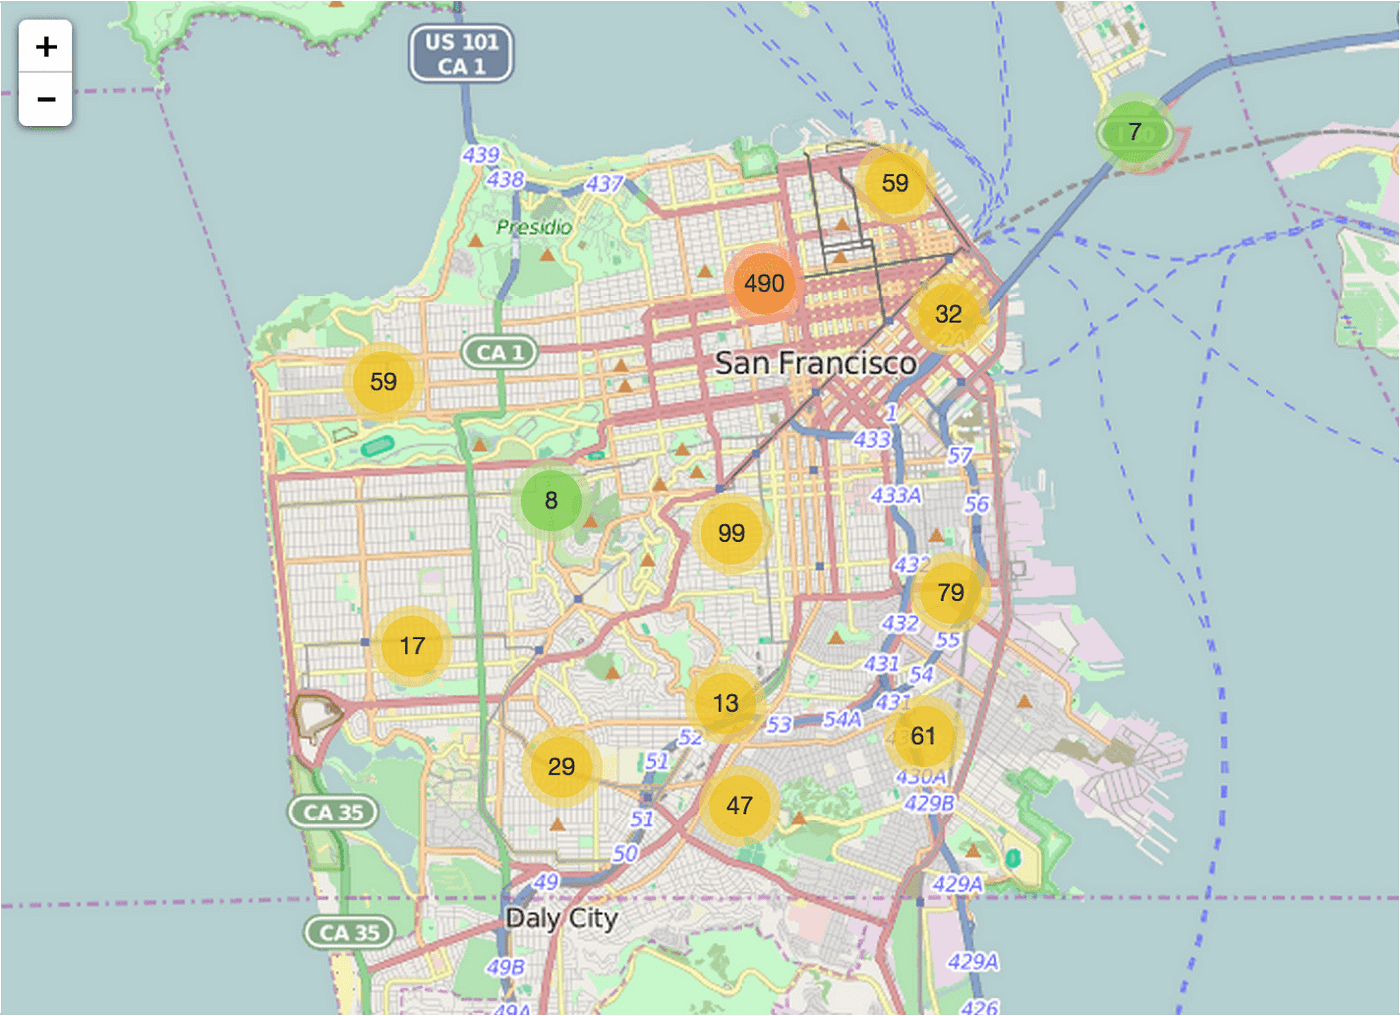
The Final Result
By the time the hackathon countdown ended, we were able to design and implement a viable solution that would achieve our initial idea. Nevertheless, this was achieved thanks to our strong team collaboration and efforts, and some sprinkled guidance from the MS architecture team.
After presenting our MVP (minimum viable product), the judges called a draw for first place. Having won the competition granted us credits to some of Microsoft Azure cloud services like storage and processing. And, the company which hosted the competition granted us seats at their co-working space, which we could use to continue the development of our application and idea.